Conservation Programs
OCEAN MONITORING INITIATIVE
Data Collection for Conservation
Providing data is the first step towards building knowledge and awareness. Data become tools for local communities and cities to dynamically grasp the status of their ocean and subsequently target action for its conservation.
The rich biodiversity Japan archipelago is hosting, provides an ideal terrain for marine species. By collecting data in various locations, OMI provides source for assessing Japan reef status, further research on marine species, support the action of local NPOs and participate to global citizen science effort. Join our programs to snorkel and dive in Japan and contribute to the effort of reef protection.
Explore
データー収集方法
Data Collection Methods
OMI is following the Global Coral Reef Monitoring Network (GRCMN) guidelines for ocean monitoring. GCRMN is a UNESCO-affiliated network under the United Nations Environment Program (UNEP) aiming to standardize coral reef monitoring globally and regionally. The network supports broader marine goals, including UN Sustainable Development Goal 14, which focuses on conserving and sustainably using marine resources. Those guidelines are part of a broader push to help practitioners contribute data that informs regional trends and statuses of coral reefs. Each of the below 6 points inform on the GRCMN goals. The 7th target reflect the effort for megafauna conservation
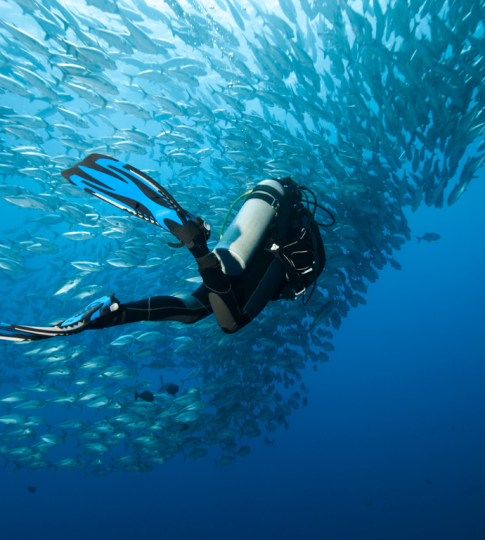
underwater visual census (uvc) - roving survey
Data collection: Density and size structure of all species intact or critical for reef ecosystem health.
Method: A group of minimum 3 research divers conduct visual recording of the number of key fish species and their size (>15cm) for 30 min.
The survey will be conducted following the standard dive pathway of each site and consistent with the agreed circuit for tourist divers.
Abundance and biomass
in key reef fish taxa
Details
All fish and other large swimming animals, i.e. those that can be viewed while swimming in the water column, above the macroalgal canopy or near the mouth of caves and ledges.
Large group of research divers and repetitive census of the site will ensure statistically representative assessment of the site’s diversity.
COral Watch
Coral health assessment
Data collection: Site assessment of coral density, coral size and disease/health. Recording of COTS.
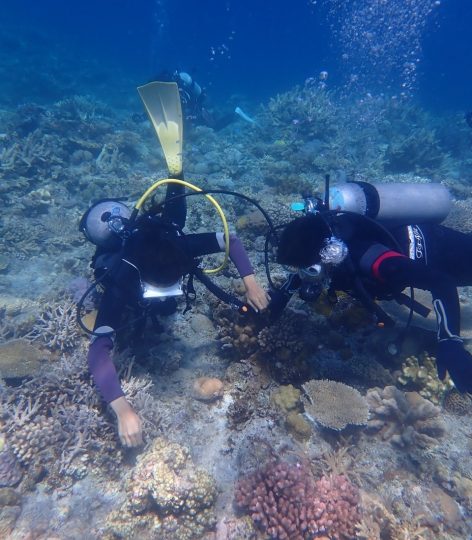
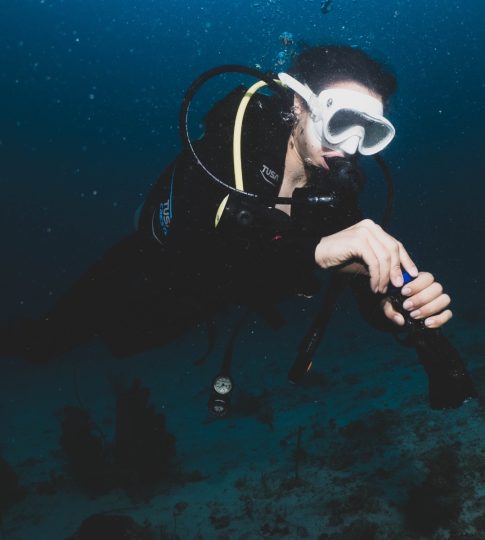
Method: A group of minimum 3 research divers conduct visual assessment of coral health, density and coral size. They support their claims with in-situ pictures. Coral health is estimated relying on the Coral Health Chart.
“The colours on the Coral Health Chart are based on the actual colours of bleached and healthy corals. Each colour square corresponds to the concentration of symbiotic algae living in the coral tissue, which is directly linked to coral health.” Queensland University
Details
One diver points randomly at different coral colonies, attributing them a number for reference. This same diver recorded the depth, diameter and height.
The remaining divers use the tool Coral Health Chart Slate to record the health of the colonie. One picture is taken for each colony.
Water Quality
Colorimetric Test kit
Data collection: Recording of temperature, nitrate/nitrite, ammonium, silicate and phosphate.
Method: At the different site and depth, particularly linked with coral assessment dives, water will be collected in a sampling bottle and analyzed on land.
Details
Corals, especially reef-building (hermatypic) corals, require nutrient-poor (oligotrophic) water to thrive. Excessive nutrients like phosphate, nitrate, and silicate can lead to algal overgrowth, which competes with corals and can lead to reef degradation. Ideal concentration ranges are:
- phosphate: 0.01–0.03 ppm
- silicate: 1-5ppm
- nitrate: <0.5 ppm
- ammonium: < 0.01 ppm
In-situ quadrats & photoquadrat
Abundance of key macro-invertebrate species
Data collection: Recording of long-spined sea urchins, nudibranchs, sea cucumbers, lobsters, and conch.
Method: A group of minimum 3 research divers conduct visual recording of benthic species. The survey will be conducted following the standard dive pathway of each site and consistent with the agreed circuit for tourist divers.
Details
Invertebrates contribute to ecosystem stability, biodiversity and resilience. Sea urchins feeds on turf algae, main competitor of corals for light and space, lobsters regulates invertebrate populations, conchs feeds on algae, diatoms and detritus maintaining clean substrate, finally, nudibranchs acts as toxins recyclers and bioindicators for health ecosystem.
Recruit reef building corals and habitat
In-situ quadrats & photoquadrat
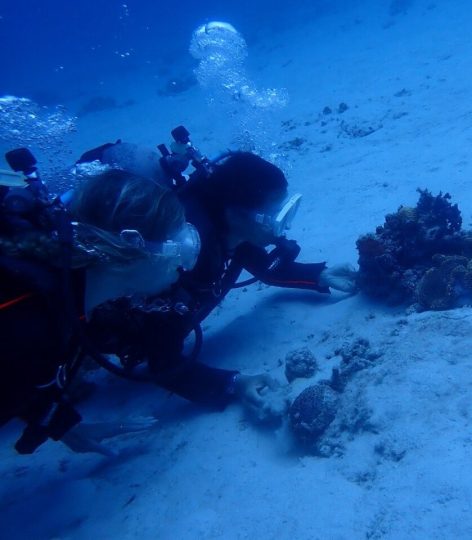
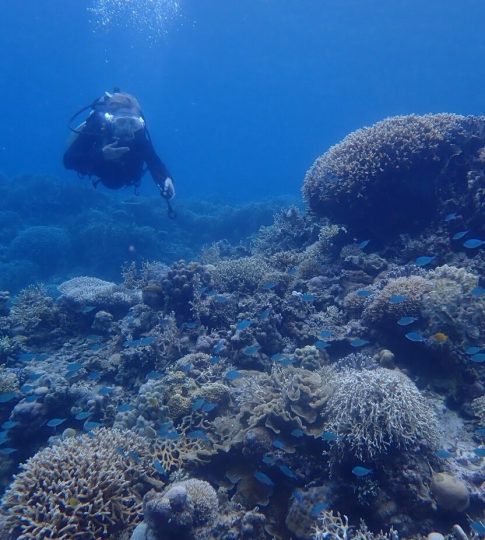
Data collection: In-situ and photoquadrats recording of stone corals that is greater than 0.5cm and up to 4.0cm in maximum diameter.
Method: A group of minimum 3 research divers conduct visual assessment of coral species, with a focus on stony coral.
Details
” Estimate the density of young corals that are likely to contribute to the next generation of adult corals on the reef, as well as providing a snapshot of the competitive environment in which young corals live. ” GRCMN
Relatives cover of reef building organism
Photoquadrat of benthic surface
Data collection: Provision of benthic pictures at different depth (5, 10, 15, 20m depending on the site).
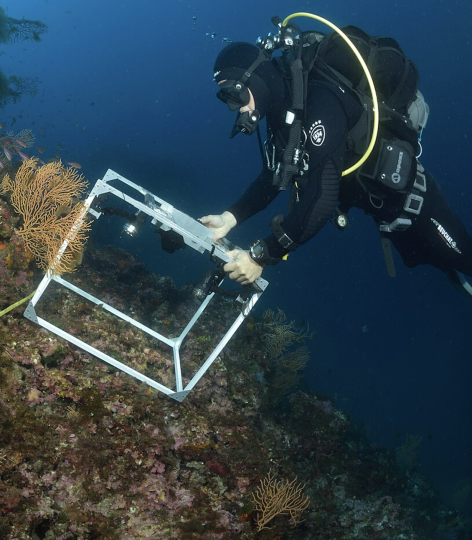
Method: During the whole dive (~45min), the quadrat is carried at alternating depths by research divers. For each depth, 35 to 40 pictures are taken at max 20cm from the ground.
Details
A quadrat made of four lengths of PVC (2 that are 0.9m long, 2 that are 0.6m long) that are coupled together with 90 ̊ angled couplers.
Images are collected that contain the standard frame and the benthic habitat within.
Citizen science and/or bruv
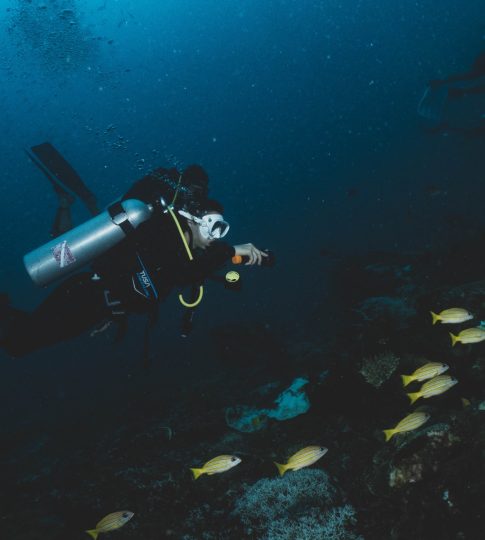
Data collection: Recording of sharks, rays and turtles as well as sightings of cetaceans (size, number, behaviors, distinctive mark)
Method: Pictures of the animal encountered for citizen science. For the BRUV method (baited remote underwater video), we are using a bait structure left for a complete hour without divers interaction at a depth of 15-25m. The structure retrieved, the video capture will be analysed on land. The same conditions for UVC data collection will be applied.
Megafauna
Details
Following citizen science standard, identification features are defined as:
- whales fluke
- dolphin dorsal fin and fluke
- turtles left cheek and carapace
- shark full side body
- stingrays full upper body
